Social Media and the Growth of Mobile Usage
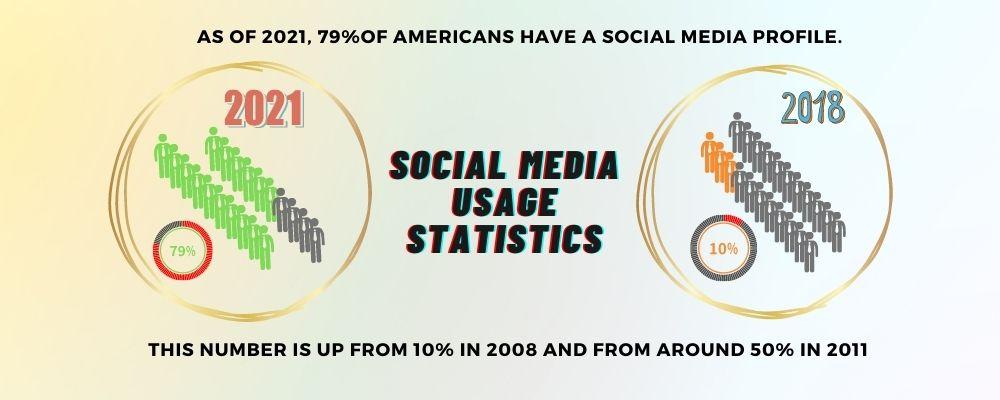
Social media usage is increasing day by day. People are spending more time using social media year by year. Social Media is a daily part of everyone’s life and deeply integrated in our social dynamics.
According to a report from Shareaholic, social media use increased at least by 10% every year from 2015 to 2022. (Yet analysts say this is a conservative estimate.)
But how much of this trend is attributed to the rise of mobile devices? Mobile devices made it possible to access social media quickly, anytime and anywhere. So their is no surprise that social media growth increased with the increase of mobile usage.
In fact, it’s been declared that in 2019, mobile users accounted for 67% of the total social media audience (Facebook, Twitter, YouTube, Instragram), and this year, in 2022, they account for 74% of the total audience.
The average person spends over 3 hours a day on social media, and it’s projected it will continue to rise with time.
Social media usage statistics
Quick introduction stats
- Nearly 21 billion new posts are created every day.
- According to the United Nations, social media is used by more than 60% of the world’s population.
- According to the company, Instagram has more than 1 billion monthly active users.
- Since YouTube has over 1.5 billion monthly active users, the site has risen to become the second most popular search engine behind Google.
Accessibility Of Social Media
More than 1.5 billion people worldwide have some form of disability. Another 3.6 billion people have some form of visual impairment, which means that access to social media is vital for people with disabilities and their loved ones. In an other SM90 article we have discussed web accessibility statistics.
Demand for Video Content is Increasing

Experts projected that the number of people watching digital videos in the United States would increase by only a few million each year (Business Insider, 2020).
But according to data, there were 1.7 trillion video views online in the United States in 2019. And in 2022, 248.9 billion hours of video were watched online in the United States.
In the upcoming year, a 13% increase from the previous year is expected. As video becomes more popular and accessible, we can expect an upward trend in the number of people watching videos online.
So, it’s time (and definitely not too late) to start creating videos. Video footage is more in demand than ever before, and next year it will be even more.
Video as a Powerful Marketing Tool

Video data can be used for more than just entertainment purposes. Research data shows that video content is a great way to increase brand awareness or to educate.
According to the United States Interactive Advertising Bureau’s (IAB) 2018 State of the Media Report, a video is valuable for businesses. It estimated that more than 200 million Americans watched 4.5 hours of video per day in 2017.
This makes the video by far the most widely used medium on the planet.
Users are consuming vedio content more than ever before. As a result, companies are creating more video content to increase the awareness of their brand.
When it comes to promoting your business online, according to studies, video is the most efficient and engaging way to do it.
The more videos your business produces, the easier it will reach the desired audience and find new leads. The good news is video creation is easier than ever now.
Video Marketing = Profit

There is no doubt that video marketing is a powerful marketing tool that can help drive sales.
Digital Video Ad Spend increased by 54% in 2023, compared to previous year. According to Statista, digital vedio ad spend is projected to reach US$191.3bn in 2024.
The video is a great way to communicate with your audience, and it can also be used as a tool to get feedback from the audience.
But what makes video marketing so effective – and the reason behind the increase in Ad Spend – is the ROI, which can reach up to 800%, and it has been proven to be effective both with content creation and paid advertising.
And today, we will see Instagram and YouTube usage Statistics in detail; don’t skip it or else you will miss crucial facts and information for your research and business!
But what’s better for video ads? Facebook ads or Instagram ads?
So, let’s start the geeky information-grabbing party.
Instagram statistics
As a mobile messaging and social media platform, Instagram is a great place to engage with your audience.
Whether it’s through photos or videos, it is a great way to deliver your message and reach a lot of people.
Instagram also boasts a high engagement rate. You can use this data to strategize and plan your content.
But, Instagram statistics alone cannot tell you much about your audience.
Remember to use analytics tools to understand your target audience better. Using the right analytics tool can give you insights into your audience, which can help you create relevant content, and we will also discuss this at the end of the article.
Now, let’s have a quick glance to some impressive Instagram statistics, which show us the amazing potential growing year by year and for the year to come.
- Instagram will reach over 2.5 billion monthly active users at the end of Q1 2024. In 2020, Instagram had the highest growth rate of any social media platform, with daily user growth of over 20 million.
- Instagram was the 4th most used social media platform by the end of 2023, with a 12% year-over-year increase in daily users.
- Instagram will grow its monthly active users to over 2.7 billion by the end of 2024, an increase of over 24 million year-over-year; on Instagram, brands spent the most on social media video advertising, with a $1.1 billion on Instagram video advertising, an increase of over 22% from the previous year.
Instagram Statistics By Age
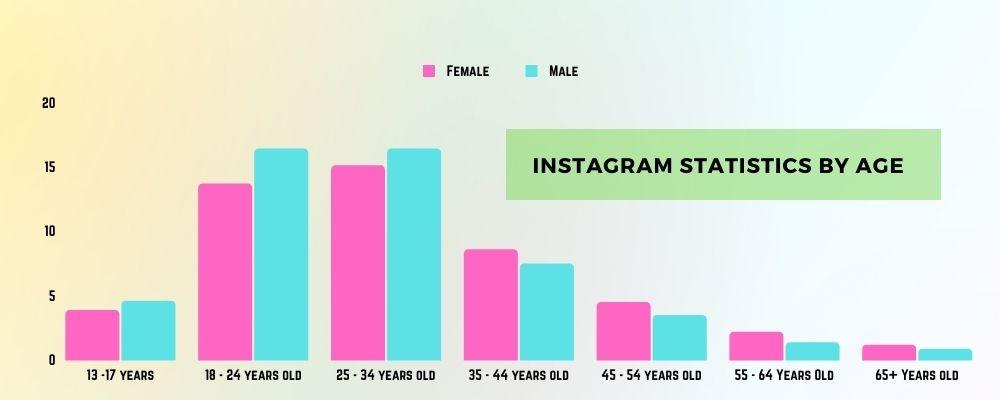
- 71% of Instagram active users are aged between 18-29.
- Twenty-nine percent (29%) of Instagram users are between 25 and 34 years old.
- 3.5% of Instagram users are between 35 and 44 years old.
- Instagram users between the ages of 45 and 54 make up 2.4% of users.
- 54 to 65 years old: only 1.9% of Instagram users are in this age group.
- 1.1% of Instagram users are 65 and older.
Instagram trend is to grow year after year, which makes it an amazing advertising opportunity – and it’s never too late to jump in the train.
Instagram users by country
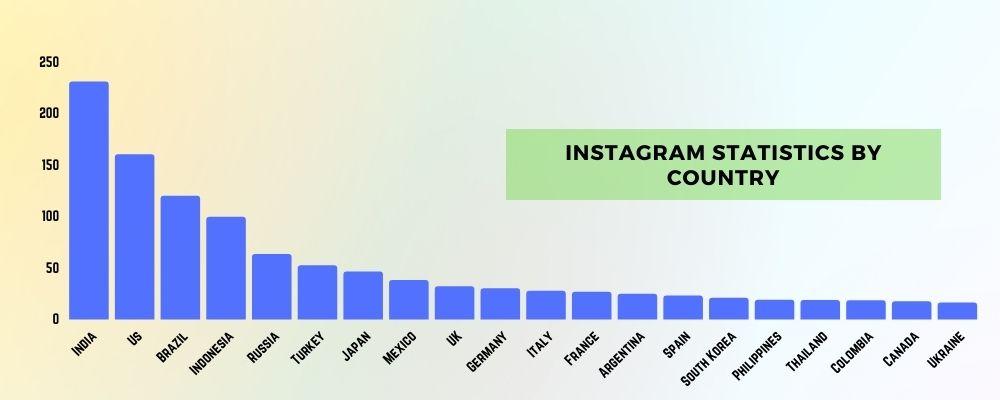
- India has more than 229 million Instagram users who are active daily.
- According to the company, in the United States, Instagram has 158.5 million active users. (In the United States, 140 million people use Instagram monthly.)
- In Indonesia, there are 6.4 million Instagram users who are active daily. (In Indonesia, there are 118 million monthly active users.)
- In Brazil, there are 4.7 million Instagram users who are active daily. (In Brazil, there are currently 91 million people who use Instagram every month.)
- In Mexico, there are 4.3 million Instagram users who are active on the platform. (In Mexico, Instagram is used by 80 million people every month.)
- In the Philippines, there are 4.1 million Instagram users who are active daily. (Instagram has 72 million monthly active users in the Philippines.)
- Vietnam has 3.8 million daily active Instagram users. (In Vietnam, the largest and most populous country, Instagram has 59 million monthly active users.
Instagram Statistics By Gender
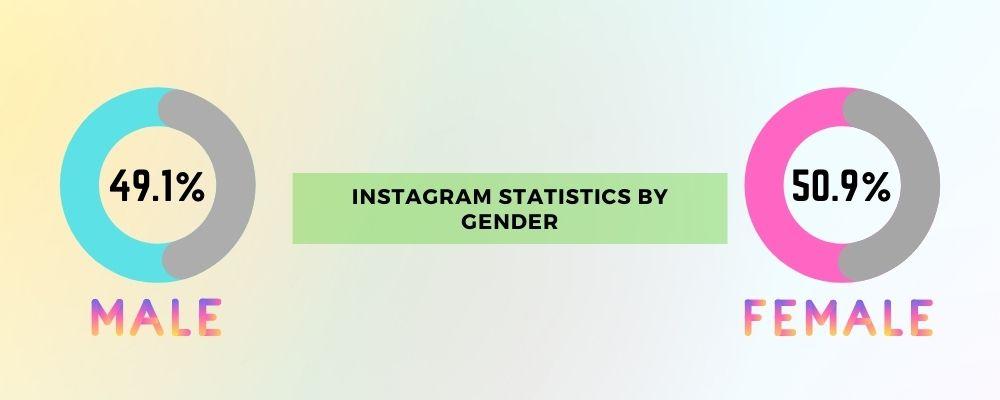
Males account for 51.8% of Instagram users, meaning that 48.2% of Instagram’s users are women.
Instagram usage by device
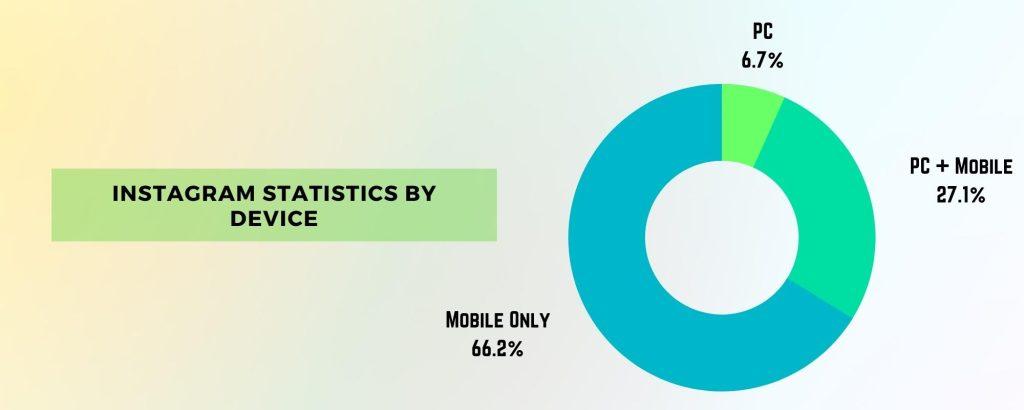
- 37.74% of the world 5.3 billion active internet users use Instagram, including desktop and mobile users.
- Only 10.28% of Instagram users use the site on a computer.
- 89.72% of Instagram users are mobile-only users.
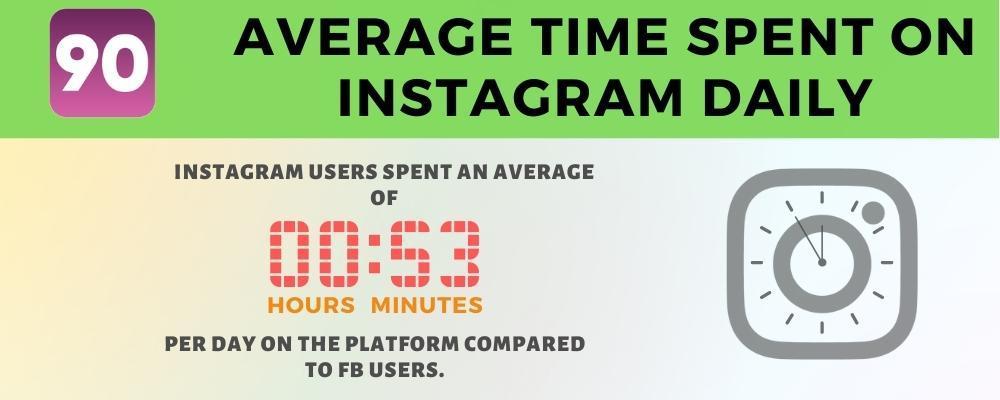
Instagram - Daily Usage Statistics
- Around 500 million Instagram users interact with Instagram Stories daily.
- Instagram Stories are shared by 40% of users every day.
- 59% of Instagram users access the service on a daily basis.
- Every day, 200 million people visit business Instagram profiles.
- Instagram is used daily by 11.01% of the world’s 4.54 billion internet users.
- Instagram is used daily by 11.96% of the world’s 4.18 billion active internet users.
Instagram Marketing Statistics

- Advertisements on Instagram can reach 96.6% users.
- Instagram’s advertising platform is used by 80% of marketers.
- Instagram advertising can persuade people to take action.
- As part of the Instagram advertising strategy, 91% of luxury firms collaborate with an Instagram influencer.
- For marketers, Instagram is the third most important social media network for which to invest time and money.
- The US advertising industry spends 31% of its total advertising expenses on Instagram Stories.
YouTube Statistics

If you’ve ever wondered where the video content is all going, you may be interested in YouTube statistics.
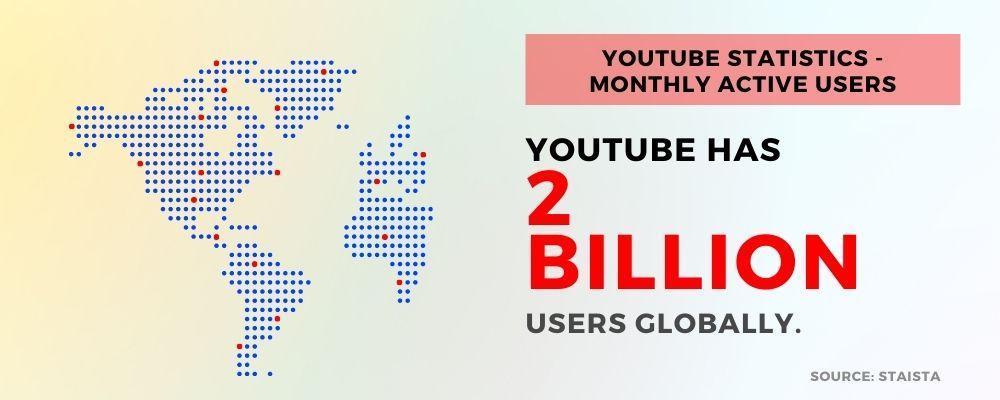
But YouTube is not just about videos. It is also the second-largest search engine in the world and it has over 2.70 billion monthly active users, and it’s becoming a go-to solution for both celebrities and businesses.
But despite its huge size, it is still largely untapped, so it is worth looking into for some insight. But how do you get those YouTube stats?
YouTube’s recent growth has prompted many to wonder if the company is going to stay that way. The answer is, of course, yes. As we just mentioned, YouTube is the second-largest search engine globally after Google, which commands 75% of the market and processes 3.5 billion searches each day.
Another reason why YouTube will keep growing year by year, is the same as the one mentioned for Instagram. With new generations connecting to the online world, established platforms such as YouTube will constantly benefit from new, young users embarking to the online world.
Also, according to a report published by Demandsage, YouTube gets 113 billion visits each months. YouTube’s content tends to be long-tail, with limited benefits from compression and caching. As such, video streaming applications will require a software-defined wide area network, such as SD-WAN. That way, YouTube can continue to meet the ever-growing demand for bandwidth. And with its recent acquisition of Snap, Google has taken steps to keep pace with YouTube’s growth. So even resource-wise, YouTube will be able to keep up to the demand.
Lastly, YouTube’s users are global. The top-performing countries and more audience related stats are shown below;
- India leads the way (with 467 million active users) in terms of total usage, but U.S. users account for a greater share of adult users.
- YouTube is also localized in over 100 countries.
- YouTube supports 80 different languages. This has made YouTube a global phenomenon, allowing the service to reach new countries very quickly.
- It is the second-largest search engine in 2024, fueled by the sheer popularity of video content.
- As already mentioned, It has over 2.70 billion monthly active users.
YouTube Statistics By Gender & age
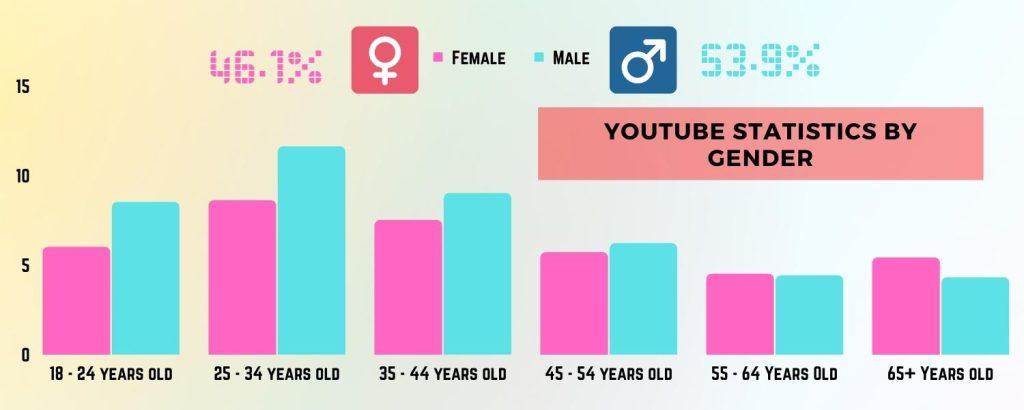
Males users make up to 54.4%.
Females are 45.6%.
Youtube users by country
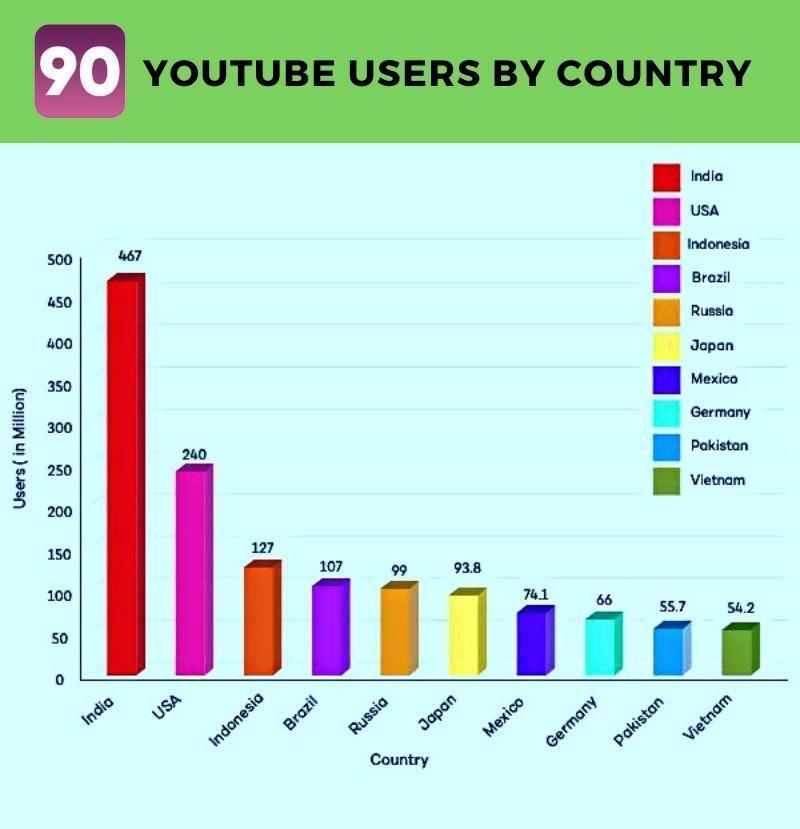
- India has the first YouTube viewership in the world, according to YouTube statistics.
- The United States has the largest number of YouTube subscribers. Nearly 78% people in the United States regularly watch YouTube videos.
- Indonesia has the second most YouTube users after the United States.
- Brazil has the fourth-largest YouTube audience.
- The YouTube audience in the Russia is the fifth-largest in the world.
- Japan has the sixth-largest YouTube audience in the world.
- More than 92.5 million people in the United States are active YouTube subscribers, or about 24.7% of the total YouTube audience.
- A whopping 1.9 million new users join YouTube each month in the United States, making it the fastest-growing country globally.
These statistics prove us how YouTube is a great platform for targeting native English people, having, in the top 5 countries with most active users, 3 out of 5 being countries speaking English as their native language. (USA, Canada, UK).
On top of that, the same countries – led by the United States – are having the strongest yearly growth – making YouTube the perfect place for targeting native English and tier 1 users.
Which social media platform should digital marketers focus on in 2022, Instagram or Youtube?

Basically the purpose of this article is to find the answer of this question…backed by statistics.
We take a look at the latest data from both platforms before drawing a conclusion.
Instagram and YouTube have a large number of active users. As of January 2024, Instagram had 2.4 billion active users, and YouTube has 2.7 billion active users.
Because of its easier to reach user base, Instagram has an advantage over YouTube, because on average, a user interacts with more pieces of content per day than on YouTube.
However, when it comes to percentage-based user interaction (engagement rate), YouTube significantly outperforms Instagram. Brands on Instagram have an average interaction rate of 0.84%. Brands on YouTube have an average interaction rate of 4.17%.
A YouTube video is 4 times more likely to be shared than an Instagram photo. To increase your brand’s visibility and interaction, you should use YouTube.
Which platform is best to maximize your brand visibility?
Instagram comes into play in this situation. Instagram’s mobile first nature is one of its most appealing features. Also, on Instagram, on average, is easier to reach more people due to the fact that active users interact with a much larger quantity of content compared to YouTube.
On the other hand, Instagram isn’t the best site if you’re looking to maximize your brand’s engagement.
Instagram VS YouTube

- Nearly 500 million people use Instagram on a daily basis.
- There are nearly 122 million people that use YouTube on a daily basis.
- YouTube is the most popular social media network in the world.
- The second-highest rate of engagement is on Instagram.
- YouTube is the second-most visited site globally, whereas Instagram is the fourth.